Configuring display settings
When you click the Change display settings button, you will be presented with this menu:
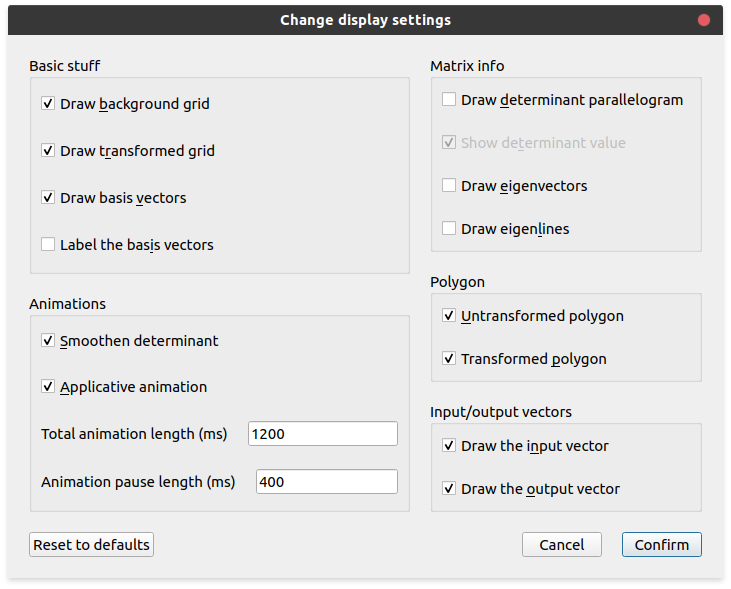
If you hover over any of the options, you’ll get a tooltip explaining what the option does. If you click the Reset to defaults button, then it will reset the settings back to these defaults.
Basic stuff
The Basic stuff section should hopefully be self-explanatory. If you want to enable or disable the background grid, transformed grid, basis vectors, or their labels, this is where you can do it. The basis vector labels require the basis vectors to be enabled.
Animations
Smoothen determinant
With this option disabled, the basis vectors will move in a straight line from their start to their end positions. But with it enabled, lintrans will try to scale the determinant smoothly during the animation. This makes most transformations look better, but sometimes you want to turn it off.
The effect of this option is very visible when animating a rotation by an obtuse angle with and without smoothening the determinant.
Animating rot(135) with Smoothen determinant on.

Animating rot(135) with Smoothen determinant off.
Applicative animation
Applicative animation is explained in Visualizing transformations. You can change between Applicative and Transitive animation with this setting.
Animation timings
All animation timings are measured in milliseconds. 1 second is 1000 milliseconds.
lintrans also allows you to change the timings of animations. The Total animation length is the total time taken for a single animation. If you’re animating a sequence with commas, then each single animation is an expression between commas, not the whole thing. This animation length may not actually be the total length of the animation, because it’s just a target. If the animation involves drawing a lot of lines in the viewport, and especially if you’re using an older computer, there might be some lag.
The Animation pause length is the amount of time that the program will pause for between expressions when animating a sequence with commas.
Matrix info
Determinant parallelogram
The determinant of a matrix is the amount by which its associated linear transformation scales areas. This is often visualized as a parallelogram formed by the two basis vectors. This parallelogram will move with the transformation. By default, it is labelled with the numeric value of the determinant, but this also be toggled.
The parallelogram is blue when the determinant is positive and red when it’s negative, so that you can tell if orientation has been flipped even if you’ve got the numeric label turned off.
The determinant parallelogram shown for A^-1rot(90),Brot(45).
Eigenvectors and eigenlines
You may not have encountered eigenvectors before. Essentially, an eigenvector is a vector that points in the direction of an invariant line. Not all matrices have invariant lines, but the invariant lines that do exist must go through the origin (because the origin is fixed), so there must be a set of vectors from the origin (position vectors) that lie along each invariant line. We take one of these possible vectors to be “the” eigenvector associated with the invariant line. Sometimes people choose a unit vector with length 1, but lintrans chooses an eigenvector with length equal to its associated eigenvalue.
An eigenvalue is essentially a scale factor associated with an invariant line, and thus with an eigenvector. If you take a point on an invariant line with eigenvalue \(\lambda\), then after the transformation, that point will still be on the line, but it will now be \(\lambda\) times its original distance from the origin. If you imagine the point as a position vector \(\vec{\mathbf{v}}\), then the transformed point has the position vector \(\lambda \vec{\mathbf{v}}\).
If \(\lambda\) is negative, then the point will move to the other side of the origin. If \(\lambda = 1\), then the line is also a line of invariant points, meaning nothing on the line moves at all. \(\lambda\) cannot be \(0\) by definition.
An eigenline is just another word for an invariant line. lintrans allows you to visualize these eigenlines and their associated eigenvectors.
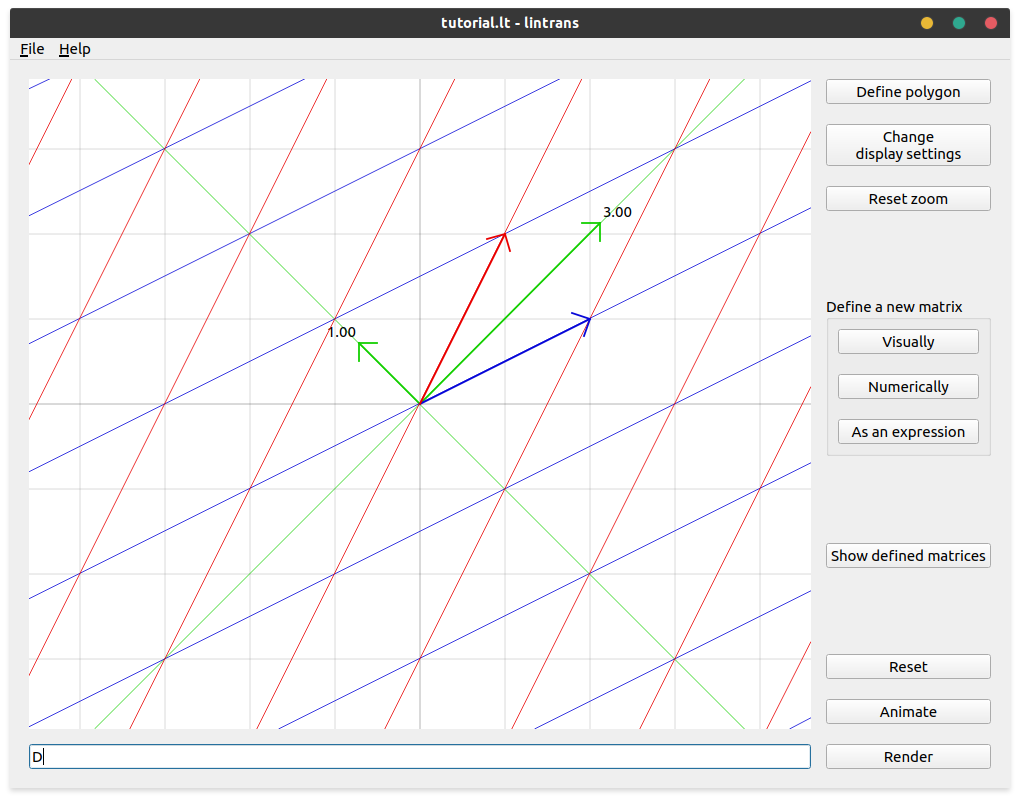
The eigenlines and eigenvectors for the matrix \(\begin{pmatrix}2 & 1\\1 & 2\end{pmatrix}\) (defined as \(\mathbf{D}\)), showcasing an invariant line and a line of invariant points.
Polygons
lintrans allows you to see a custom defined polygon before and after any given transformation. You can show or hide both the transformed and untransformed versions separately with these display settings.
See Visualizing transformations to learn more about these polygons.
Input/output vectors
lintrans supports the ability to drag an input vector and see how it gets transformed by the currently displayed transformation. The display settings allow you to show or hide this pair of input and output vectors individually. See Visualizing transformations.